General

Biology@Carmel News
Welcome to the Biology Connect site. Please email kimn@carmel.ac.uk with any feedback you have about the site.
Teams timetable for Biology students

Tutorials:
Aiming for the A- Focusing on skills to achieve A-A* grade in Biology including exam question practice of more challenging Biology questions, how to tackle more challenging questions, developing essays and maths skills. Year 2 only.
Booster- Focusing on Boosting Biology skills and improving exam technique include comprehension questions, maths skills, understand the question and practical based exam technique. Sessions involve practice exam questions to perfect your technique. Year 1 students (Monday) and Year 2 (Wednesday) sessions.
Support- Focusing on recapping key content and terms, developing more efficient revision techniques and applying this content to exam questions to practice exam technique. Year 1 students (Fridays with Dan) and Year 2 (Fridays with Kim).
If there are specific topics, content, techniques you are struggling with then you can also speak.email, teams your Biology teacher as well.
This folder contains all of the Booklets, PowerPoints and Homeworks for the Year 1 topics. For on-line learning resources please go to the on-line learning tab which is below
This folder contains all of the Booklets, PowerPoints and Homeworks for the Year 2 topics
Maths Skills
*** Mathematical Skills required ***
The following are formulae you must LEARN and be able to use or rearrange:
- From Cell structure booklet -Magnification triangle to work out ACTUAL, IMAGE or MAGNIFICATION of an image.- From Transport in animals: Cardiac output triangle.
- From Biodiversity within a community: Index of diversity
- From Energy in ecosystems: Energy equations ENTERING the ecosystem and BETWEEN trophic levels.
- From Inheritance: Chi-squared calculation
- From Populations: Hardy Weinberg
-------------------------------------------------------------------------------------------------------------------------------------------------------
*** Specification points ***
Arithmetic and numerical computations
MS 0.1: Recognise and make use of appropriate units in calculations:
* Convert between units, eg mm3 to cm3 as part of volumetric calculations. (Answers to tasks)
* Work out the unit for a rate, eg breathing rate
MS 0.2: Recognise and use expressions in decimal and standard form:
* Use of appropriate number of decimal places in calculations eg for a mean. (Markscheme)
* Carry out calculations and convert between numbers in standard and ordinary form, eg use of magnification, volumes (Markscheme)
* Understand standard form when applied to areas such as a size of organelle.
* Convert between numbers in standard form and ordinary form
* Understand that significant figures need retaining when making conversions between standard and ordinary form, eg 0.0050 mol dm–3 is equivalent to 5.0 × 10⁻³ mol dm–3
MS 0.3: Use ratios, fractions and percentages:
* Calculate percentage change (Markscheme)
* Calculate surface area to volume ratio (See Induction homework in 4.1 Section- scroll down)
* Use scales for measuring
* Represent phenotypic ratios (monohybrid and dihybrid crosses)
MS 0.4: Estimate results:
* Estimate results to sense check that the calculate values are appropriate.
MS 0.5: Use calculations to find and use power, exponential and log functions:
* Estimate the number of bacteria grown over a certain length of time. ( with PowerPoint)
* Apply logs to any given data. ( See M.S 2.5 for example activities)
____________________________________________________________
Handling Data
MS 1.1: Use appropriate number of sig figs:
* Report calculations to an appropriate number of significant figures given raw data quoted to varying numbers of significant figures (Answers)
* Understanding that calculated results can only be reported to the limits of the least accurate measurement
MS 1.2: Find arithmetic means:
* Calculate or compare the mean, median and mode of a set of data (Answers)
MS 1.3: Construct ad interpret frequency tables and diagrams, bar charts and histograms.
* Represent a range of data in a table with clear headings, units and consistent demical places
* Interpret data from a variety of tables
* Plot a range of data in an appropriate format eg enzyme activity over time as a graph.
* Interpret data from a variety of graphs eg explain an ECG graph.
MS 1.4: Under simple probability:
* Use the terms probability and chance appropriately
* Understand the probability associated with genetic inheritance
MS 1.5: Under the principle of sampling as applied to data:
* Index of diversity.
MS 1.6: Understands the term Mean, mode and median:
* Mean, mode and median ( See MS 1.2 for worksheet and answers)
MS 1.7: Use a scatter diagram to identify a correlation between 2 variables:
* Interpret a scattergram eg enviro factors on lung/cardiac disease.
MS 1.8: Make order of magnitude calculations.
* Magnification formula eg Magnification = size of image/size of real object.
MS 1.9: Select and use a stats test:
* Chi-squared to test significance of difference between O and E results. (Video activity sheet, answers to video activity, practice activity, answer to practice activity)
* Student T-test
* Correlation coefficient- Spearman's rank.
MS 1.10: Understand measures of dispersion include SD and range.
* Comment on SD
* Understand why standard deviation might be a more useful measure of dispersion for a given set of data (Worksheet) (Answers)
MS 1.11: Identify uncertainties in measurements and use simple techniques to determine uncertainty.
* Calculate % error
___________________________________________________________
Algebra
MS 2.1: Understand and use the symbols: =, <, <<, >>, >, ∝, .
MS 2.2: Change the subject of an equation
* Re-arrange formula.
MS 2.3: Substitute numerical values into algebraic equations.
* Magnification triangle, cardiac output, index of diversity, etc.
MS 2.4: Solve algebraic equations
* Magnification triangle, cardiac output, index of diversity etc
MS 2.5: Use logs in relation to quantities (Markscheme)
___________________________________________________________
Graphs
MS 3.1: Translate information between graph, numerical and algebraic forms:
* Understand that data may be represented in a number of formats
MS 3.2: Plot 2 variables from experimental data
* Select an appropriate format for plotting data, bar charts, histograms, graphs and scattergrams (Activity sheet 1, activity sheet 2, activity sheet 3)
MS 3.3: Understand that y-mx + c represents linear relationship.
* Predict/sketch the shape of a graph with a linear relationship (Graph drawing rules)
MS 3.4: Determine the intercept of a graph
MS 3.5: Calculate rate of change from graph showing linear relationship
* Calculate rate from graph. (Answers) ANSWERS AT THE BOTTOM OF THIS PAGE
MS 3.6: Draw and use the slope of a tangent as a measure of rate of change
* Method to measure the gradient of a point on a graph
___________________________________________________________
Geometry and trigonometry
MS 4.1: Calculate circumference, SA and V of regular shapes
* Calculate the C and A of a cicrcle
* Calculate SA and C of prism, cylindrical prism and spheres
* Calculate SA and V of cells.
Induction homework covering MS 4.1
___________________________________________________________
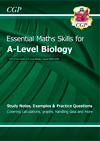
We would recommend you buy a copy of the "Essential maths skills for A-level Biology" CGP revision guide.